Use Wardley Maps to stop software development waste
 Knowing when to build vs when to buy can seem like a dark art at times. But what if we told you there is a tool/model that can make the process a little more objective? What if we showed you how to do it?
Read on, and we will do exactly that!
Knowing when to build vs when to buy can seem like a dark art at times. But what if we told you there is a tool/model that can make the process a little more objective? What if we showed you how to do it?
Read on, and we will do exactly that!
In a previous post, we discussed how No-Code covers a crucial niche for companies. But we stopped at the conclusion that No-Code tools are something companies should use. In this article, we intend to go deeper into “when” to use these tools.
In fact, we want to go broader. Let’s not only decide if we should use No-Code. Let’s look at the general version of the problem: when should you build software in-house?
When you’re building software for your organisation, you have to think about things like how much it costs, how long it takes, and other factors. This is tough, especially when you have to decide if buying software is a better alternative.
One useful tool that can help you navigate this decision-making process is the Wardley map. In this blog post, we will explore how to use Wardley maps to determine when to build in-house, when to buy software, and when to use no-code tools.
What is a Wardley map?
A Wardley map is a visual representation of the components that constitute a system, and the relationships between those components.
Wardley maps help teams understand the value chain of a system and the components that are most critical to the organisation. As a result, we can use that information to decide our software strategy.
The Wardley map has four key components:
- User Needs: The first component of a Wardley map is user needs. This refers to the purpose: what are we building something for, what does a user want.
- Value Chain: The value chain represents the components that form the system. These can be servers, factories, materials, or other things.
- Evolution: Evolution refers to the maturity of the system components, from Genesis to Commodity. Some components will be commodities, like electric power. Others will be custom-built for your user needs, them being a business advantage. Or innovative elements, placed in the Genesis section.
- Landscape: Landscape represents the external factors that can affect the system. These can be technology trends, regulatory changes, and competition. They will impact the evolution of components.
One typical example of a Wardley Map, generated via an online tool, is:
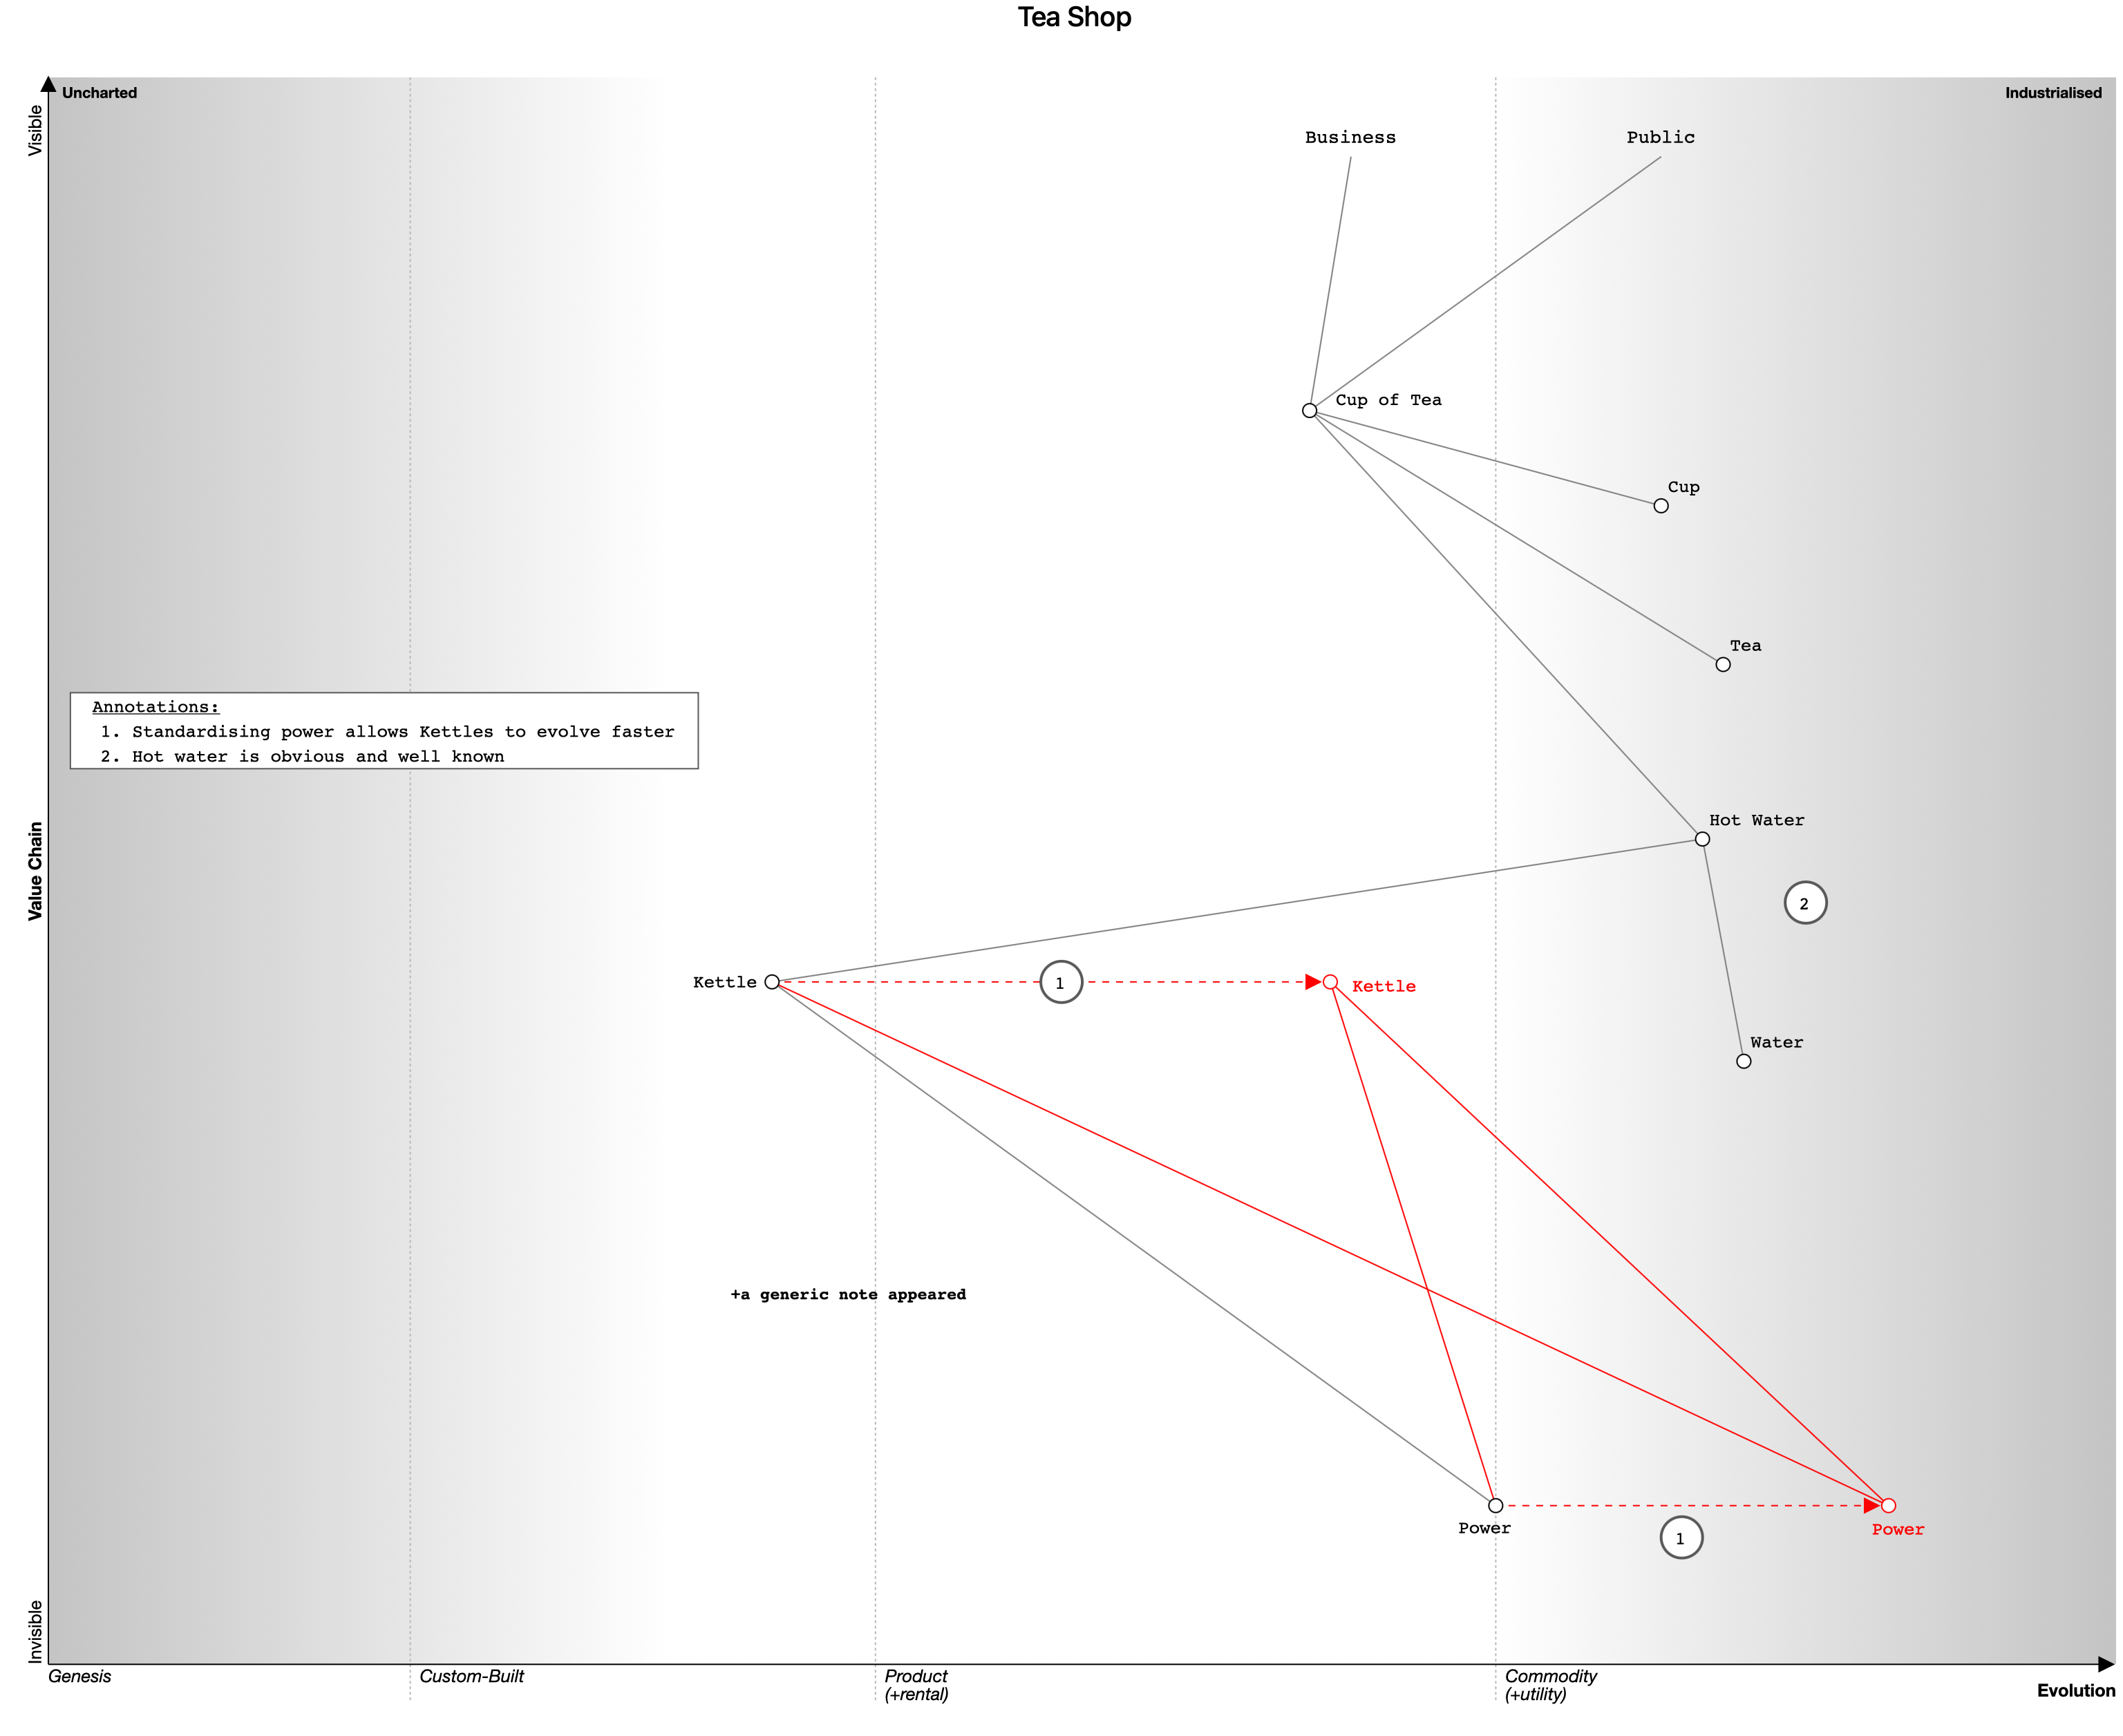
In the map above, user needs are a “Cup of Tea”. We see a value chain of components in the system, ranging from a cup to the power required by the kettle.
On the horizontal axis we see the evolution of components. For example, a kettle moving from being a custom component to becoming a product. Or electricity and water being commodities.
And in the vertical axis we see how a user perceives the value of each component, from the ones they interact with, to the ones they aren’t aware of.
It is essential to remember the aphorism: “All models are wrong, but some are useful”. A Wardley map is a representation to guide your decisions, but it won’t be perfect. For this reason, you mustn’t create a map alone, but in collaboration. The discussions about what to add to the map and where to classify the elements are invaluable.
If you are not familiar with Wardley Maps, but want to dive deeper, we can recommend this course as a starting point. For now, we will move on to using them.
Using Wardley maps to manage your software
Wardley maps intend to provide awareness of your business proposition, and the evolution stage of its components. This information can lead to decisions on how to handle those components.
Let’s use an example to illustrate its value. Assume that your organisation needs a customer relationship management (CRM) system. You can then start by mapping out the user needs for the system. This might include tracking customer interactions, managing sales leads, and generating reports.
Next, you would map out the value chain for the CRM system. This might include components such as a database to store customer information, a user interface for data entry, and a reporting tool.
Then we can arrange the different components according to their evolution stage. This includes identifying which components are in the initial development stage, which ones are becoming commodities, and which ones are already commoditised
We can end up with something like the following map:
This is a very simplified example for the article. In your map, there’s likely to be many more components.
Once you have mapped out the value chain, you can then identify which components are critical to the organisation, and which ones are less important.
At this point, you have a snapshot of the priorities of the business for a given use case. Note that a map will usually refer to a set of user needs, but those may not always be all the user needs a company serves.
It is likely that you will generate several maps, with overlapping areas. And in some maps, some components will always be commodities or products. But in others, a similar component may be custom-built. This is important information that can help you detect misalignments within the organisation.
Once you are happy with your map, then it’s time to put the information to use.
Benefits of a Wardley map
By creating a Wardley map, one obtains a view of the components impacting the business. This is useful for any business, as not being aware of your dependencies is dangerous. This information provides many benefits for the company:
- Clarity: Wardley maps provide a clear, visual representation of the components and dependencies within the business. This can help organisations better understand how their systems work and how they can be improved.
- Strategic decision-making: By mapping out the value chain of a project, organisations can identify which components are critical to their business and which can be deprioritized or outsourced. This can help organisations make more informed decisions about where to invest their resources.
- Future-proofing: Wardley maps can help organisations anticipate future changes and opportunities in the market. By understanding the evolution of the components in their software systems, organisations can be better prepared to adapt to changing market conditions.
- Collaboration: Wardley maps can be a valuable tool for facilitating communication and collaboration within an organisation. By providing a shared understanding, teams can work together more effectively and make better decisions.
- Efficiency: By identifying which components of a software project can be commoditized or purchased, organizations can save time and resources that would otherwise be spent building those components in-house. This can result in greater efficiency and cost savings.
- Risk management: Wardley maps can help organizations identify potential risks and dependencies in their components. By understanding these risks, organizations can take steps to mitigate them and reduce the likelihood of failure.
Use Wardley maps to determine software decisions
Can we use Wardley maps to guide our software decisions? The answer is: yes. The evolution status and visibility indicates how critical it is for the business. In the software world, that translates into a direct decision on how to handle it.
In the example map above, we are aware that databases are a commodity. We know building software is subject to many constraints. And it is expensive. Building your own database provides no competitive advantage. It is more cost-effective to buy one or, in the cloud world, rent one from your provider.
We have two other components in the map which aren’t commodities: a data entry interface, and a reporting tool.
The reporting tool is at the Product stage. Components at this stage have lower business value, as they are on the way to become commodities. There may be a few custom solutions out there, but the business won’t careabout the differences. At this stage, we want to rent. Or we may decide to use No-Code tools, to lower the cost of building a solution. Any constraints imposed by a No-Code tool are not a big deal, as we are at the Product evolution phase, and we allow for some customisation.
The last component, the data entry interface, is placed in the Custom-built category. This indicates that it is a component with high-value for the business. It is likely to provide some competitive advantage, and its performance is likely to impact revenue directly. These are the kind of components that we want to build in-house.
Conclusion
Wardley maps can help teams understand the value chain of a system and its dependencies. They surface information about the value of each component in the context of customer needs.
Then a company can make decisions about those components. When talking about software components, a Wardley map simplifies the task of choosing what to build in-house, what to buy, and what to build using no-code tools.
Next Steps
Once you have identified how to handle your software components, the next step is to assign teams to each one, where required.
Team Topologies is a framework for organizing teams developed by Matthew Skelton and Manuel Pais. The framework is based on the idea that different types of teams are better suited for different types of tasks.
In a follow-up article, we will talk about how Team Topologies can help you determine the teams to assign for each of the components you identified.